S&P 500 Breaks 50-Day Moving Average as Oil and Yields Surge

Why It's Trending: Financial markets are experiencing severe volatility as key technical supports break under the pressure of surging commodity prices and rising bond yields. Investors are anxiously positioning themselves ahead of the crucial Consumer Price Index (CPI) inflation print, which will dictate Federal Reserve policy. This macro convergence has dominated market feeds and sparked widespread portfolio rebalancing.
The Reality Check: While surging oil and yields create short-term headwinds for equities, the overarching market trajectory remains tied to the upcoming inflation data and how the Federal Reserve interprets incoming economic signals. Traders should prepare for heightened intraday volatility as technical levels are rigorously tested.
Wall Street woke up to a harsh reality check as stock futures tumbled, pushing the benchmark S&P 500 decisively below its closely watched 50-day moving average. This technical breach signals a shifting momentum narrative among institutional traders, compounded by an aggressive surge in crude oil prices and climbing Treasury yields. With the latest Consumer Price Index (CPI) inflation report looming large, the market’s fragile equilibrium is being tested on multiple fronts.
The Macro Pressure Cooker: Yields and Oil Spike
The convergence of rising energy costs and elevated bond yields has historically created a toxic environment for risk assets. As crude oil prices climb due to supply tightening and geopolitical tensions, inflationary pressures are once again taking center stage. Simultaneously, Treasury yields have marched upward, forcing equity valuations to reprice rapidly. When borrowing costs rise alongside energy inputs, corporate profit margins face an immediate squeeze, leaving growth-heavy indices particularly vulnerable.
Markets do not move in a vacuum; the simultaneous escalation of oil prices and bond yields creates a formidable headwind that tests even the strongest technical supports.
Market analysts note that breaking the 50-day moving average is not just a psychological blow; it triggers systematic selling programs from trend-following algorithms. This institutional de-risking accelerates downward momentum, making defensive positioning the primary strategy for many portfolio managers as they await hard data from Washington.
All Eyes on the CPI Inflation Print
The ultimate catalyst for this week’s market direction rests squarely on the forthcoming CPI inflation report. Wall Street economists have combed through previous employment and wage data, but consumer prices remain the definitive barometer for the Federal Reserve’s next interest rate decision. If inflation prints hotter than anticipated, expectations for a near-term monetary policy pivot could evaporate entirely, keeping rates higher for longer.
- Technical Breakdown: S&P 500 slips below the critical 50-day moving average line.
- Energy Shock: Crude oil surges, reigniting imported inflation fears across global supply chains.
- Yield Reaction: Treasury yields climb higher, pressuring high-multiple tech and growth stocks.
Ultimately, navigating this choppy environment requires strict risk management. Whether this technical breakdown marks the beginning of a deeper correction or merely a temporary shakeout before the CPI release will depend heavily on the Federal Reserve’s credibility and the resilience of corporate earnings.
💡 Frequently Asked Questions
❓ Why did the S&P 500 break its 50-day moving average?
The benchmark index fell below its 50-day moving average due to heavy selling pressure driven by surging crude oil prices, rising Treasury yields, and pre-CPI report anxiety.
❓ How do rising oil prices and yields impact stocks?
Higher oil prices increase operational costs and inflation fears, while rising bond yields offer safer alternative returns, both of which compress stock valuations and corporate profit margins.
❓ What is the next major catalyst for the market?
The upcoming Consumer Price Index (CPI) inflation report is the primary economic catalyst that will dictate near-term Federal Reserve monetary policy and market direction.
🔥 Recommended For You
Touch to Read Next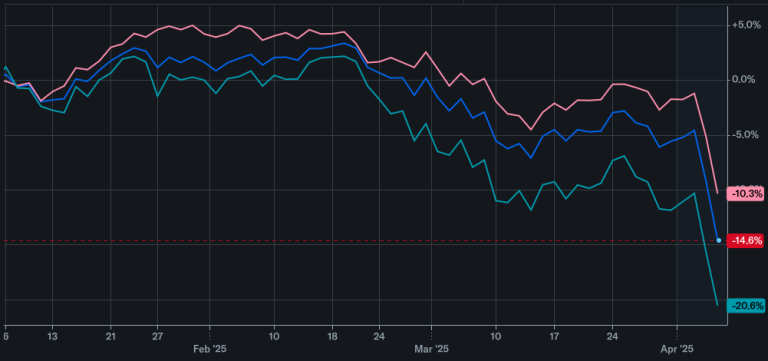
Stock Market Today: Dow Opens Higher Amid Inflation Report

Trump and Vance Headline Dallas Republican Midterm Convention

Cargo Jet Tried Aborting Landing Before Miami Crash: Flight Data